StockChart is the ultimate stock investing research app that is designed with minimalism in mind. Follow your stocks and view their daily performance. Access interactive charts that show prices, financials, and latest trends.
FEATURES
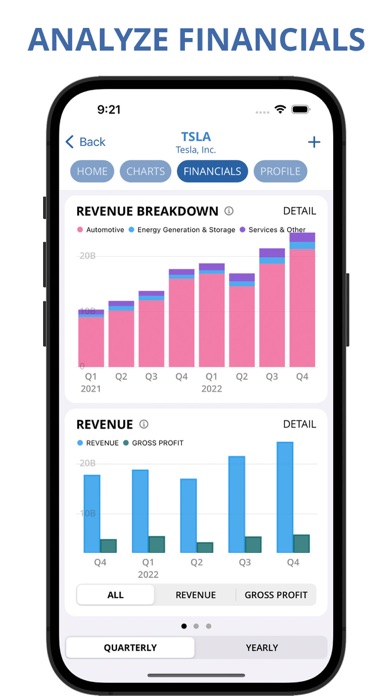
- Interactive charts (line, bar, pie) that show prices, revenue, net income, cash flow, etc.
- Breakdown of revenue sources for each company
- Customizable watchlist that displays percent, change, and market cap
- Simple definitions for every financial metric in the app
Read more about our Terms of use:
https://stockchartsapp.github.io/termsOfUse.html
What's new (v2.9)
- Stacked Lines -
Stacked bar graphs are now accompanied with line charts.